
📊 Nifty 50 Daily Analysis – April 23, 2025
📈 Price Action:
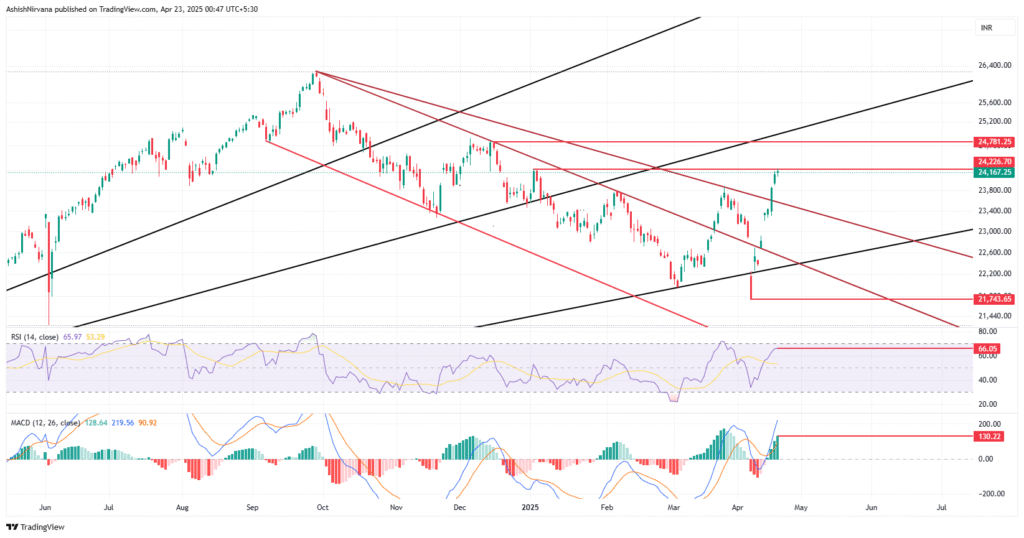
- Closing Price: 24,167.70
- Nifty has broken out above the downward red channel, marking the end of a long consolidation and signaling a strong bullish breakout.
- A successful retest near ₹24,167 further strengthens the breakout case.
🔍 Key Levels:
- Immediate Resistance: 24226 And 24781
- Immediate Support: 23,870
- Major Support: 23300 – 400 Middle Bollinger Band
📏 Trendlines & Pattern:
- Breakout from downward red channel (bearish structure)
- Held onto the long-term black upward trendline
- Market structure shows signs of bullish continuation
📉 Indicators:
🔸 RSI (14):
- Value: 65.97
- Approaching overbought territory but still suggests strong bullish momentum.
🔸 MACD:
- MACD Line (219.56) > Signal Line (90.92) – Bullish crossover
- Histogram expansion confirms upward momentum at 130
🔸 Bollinger Bands:
- upper Bollinger Band at ₹24,323
- This indicates a strong momentum breakout; however, it can sometimes signal short-term overextension.
- Volatility is expanding (widening bands), which typically precedes large directional moves – bullish move.
💼 FII Activity:
- Foreign Institutional Investors (FIIs) were net buyers of ₹1,290.43 Cr
- This strong buying interest reinforces the bullish sentiment and adds institutional confidence to the breakout.
USD INR – 85.14 Near to Support
Indian Rupee Strong and FII Buyer.
🧭 Trading Strategy:
🔼 For Bulls:
- Stay long with a trailing stop-loss just below ₹24,000.
- Watch for a move toward ₹24,781.25 in the short term.
- Any dips toward ₹24,100–24,200 can be buy-on-dips opportunities.
🔽 For Bears:
- Wait for price to show weakness near upper resistance or signs of reversal (e.g., RSI divergence or bearish engulfing candles).
- Caution: Fighting strong momentum can be risky unless confirmation is seen.
📢 Conclusion:
Nifty 50 has delivered a powerful breakout, supported by bullish indicators, FIIs buying ₹1,290.43 Cr, and a close above the upper Bollinger Band. While near-term overbought conditions exist, the broader structure favors bulls unless ₹24,000 is broken on the downside.

