📊 NIFTY 50 Daily Technical Overview
🗓️ Date: April 24, 2025
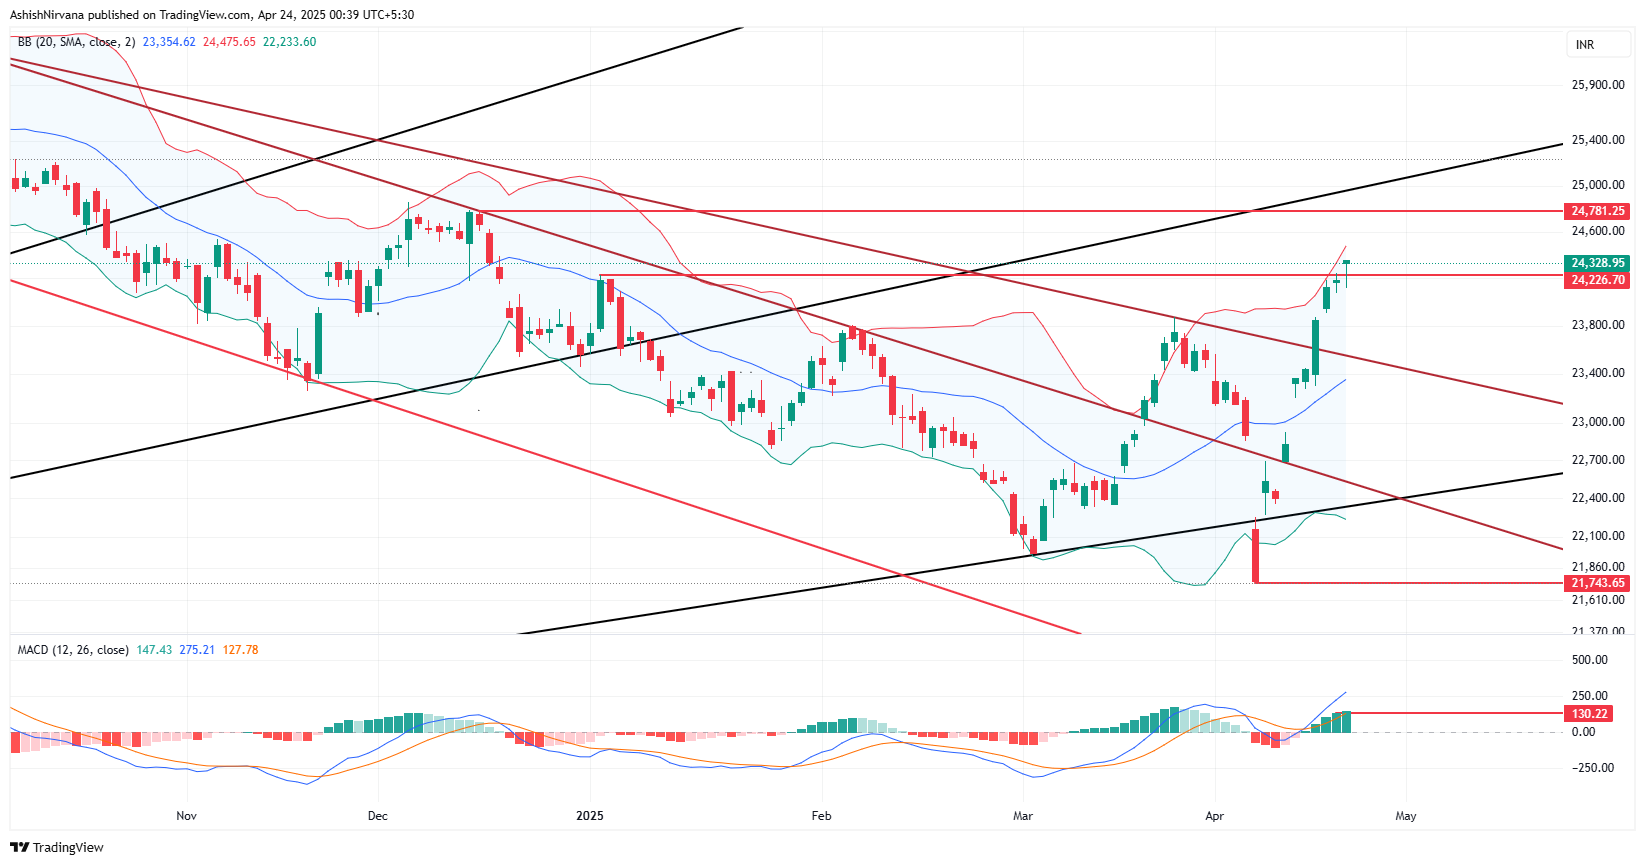
🔺 Price: ₹24,328.95
📈 Trend: Bullish (Short-Term)
🧭 Price Action:
- NIFTY has broken out of a falling channel and is now trading in a rising parallel channel.
- Approaching major resistance zone: 24,781
- Structure is forming higher highs and higher lows, confirming strength.
📉 Indicators:
| Indicator | Value | Signal |
|---|
| RSI (14) | 67.70 | Strong – nearing overbought |
| MACD Histogram | 141.98 | Bullish momentum building |
| Bollinger Bands | | |
| Upper Band | ₹24,414.62 | Price trading near this zone |
| Middle Band (20 SMA) | ₹23,810.12 | |
| Lower Band | ₹23,205.63 | |
📌 Key Levels:
| Type | Level (₹) |
|---|
| Resistance | 24,781 |
| Support | 24,245 |
| Target | 25,400+ (if breakout sustains) |
🌏 Macro Insights:
🏦 FII Activity:
- Net Buying: ₹3,332.93 Cr
- 🔍 Interpretation: Significant FII inflows – bullish confidence in Indian equities.
💱 USD/INR Rate: ₹85.35
- A weak rupee may support export-heavy sectors like IT & Pharma.
- Might signal risks – watch for RBI commentary.
✅ Conclusion:
- Momentum and structure remain bullish.
- Keep an eye on ₹24,781 breakout – it may lead to quick rally toward ₹25,400.
- Short-term consolidation possible due to RSI near overbought zone.


